Open sourceNo cloudNo account

Your health data in your own Postgres and Grafana

The Life Dashboard stack is an open-source backend for both apps: a receiver that checks signatures, Postgres and six Grafana dashboards. One compose file installs it, each phone pairs by QR code, and a read-only API and an MCP server give the data back to your scripts and to an AI you choose.

Demo data · Helm chart for Kubernetes

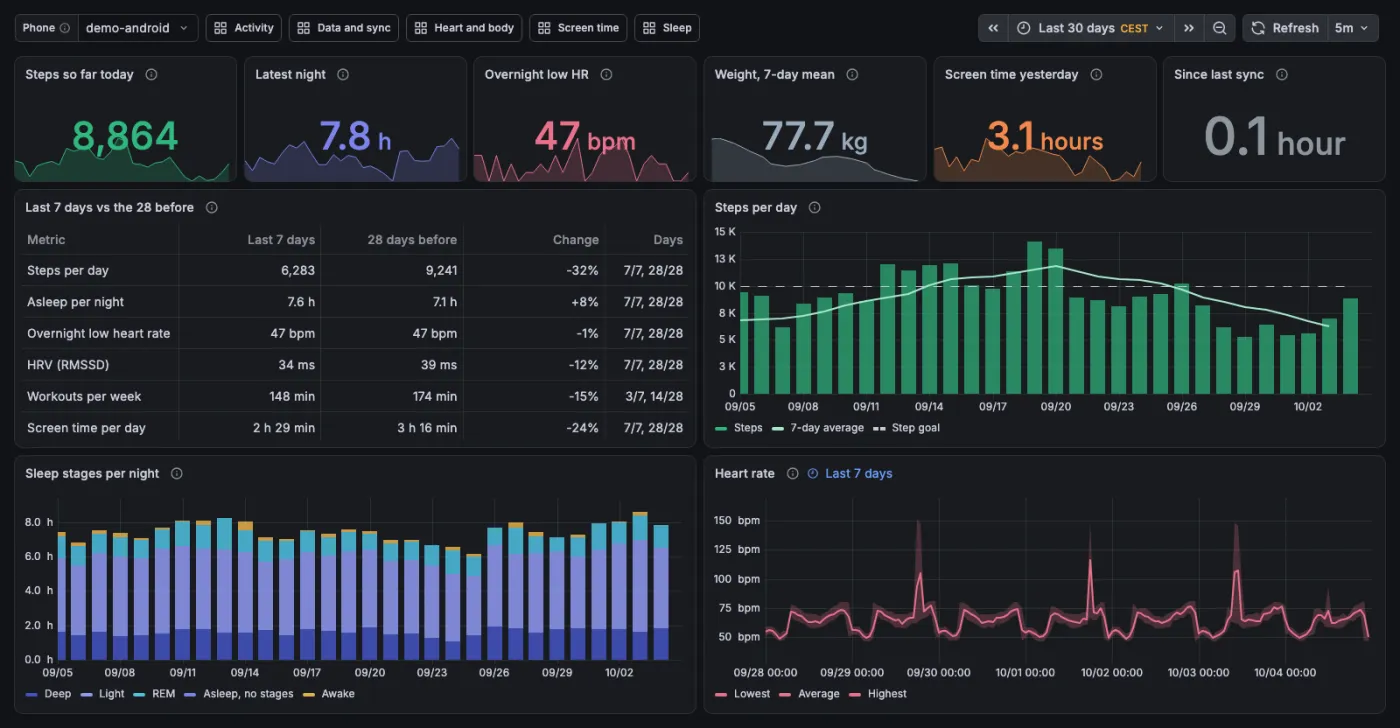
The overview dashboard of the Grafana stack with demo data

What it does

One file to install

A docker-compose.yml and an example .env from the release. The images are published for amd64 and arm64, so nothing is cloned or built.

Paired by QR code

Like the Home Assistant integration: the receiver shows a code, the app scans it, and you type neither the address nor the secret.

Six dashboards

Overview, Activity, Sleep, Heart and body, Screen time, and Data and sync, in a Life Dashboard folder, with a Phone picker on each.

Every record in Postgres

The receiver checks the X-Signature HMAC, applies a repeated payload once and removes what the phone reports as deleted.

Your data back

A read-only JSON API with a token of its own, for a script, a widget or a spreadsheet: days, nights, workouts, screen time and trends.

Ask your own AI

An optional MCP server with six read-only tools, for a local model or Claude. No tool writes, and none takes SQL.

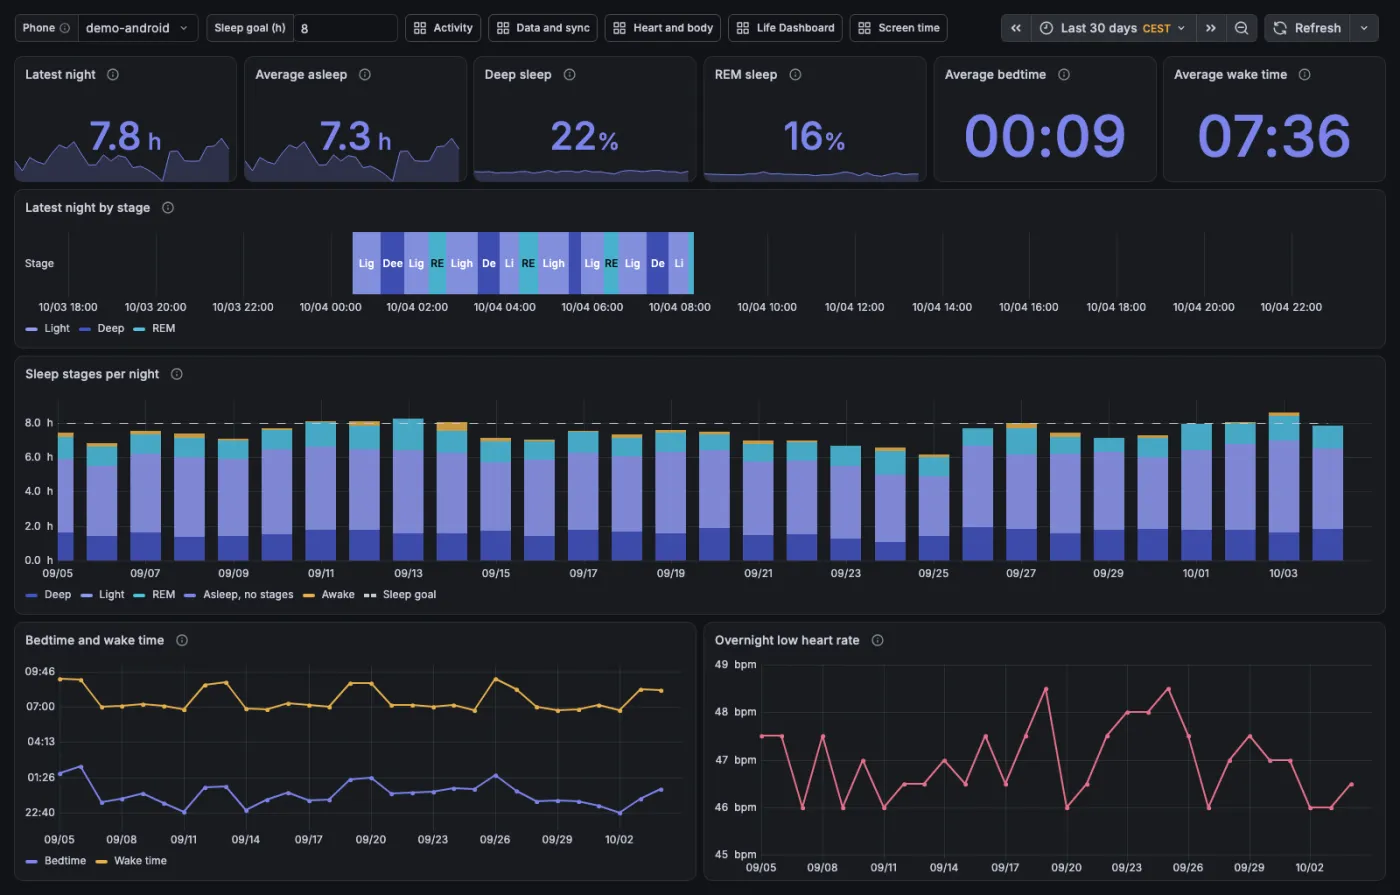
The sleep dashboard of the Grafana stack
Dashboards

Sleep, activity, heart and screen time in Grafana

Every dashboard has a Phone picker and links to the other five that keep the time range. Each panel has an info icon that says where its figure comes from.

  • Life Dashboard overview How today and last night went, and this week against the four before it.
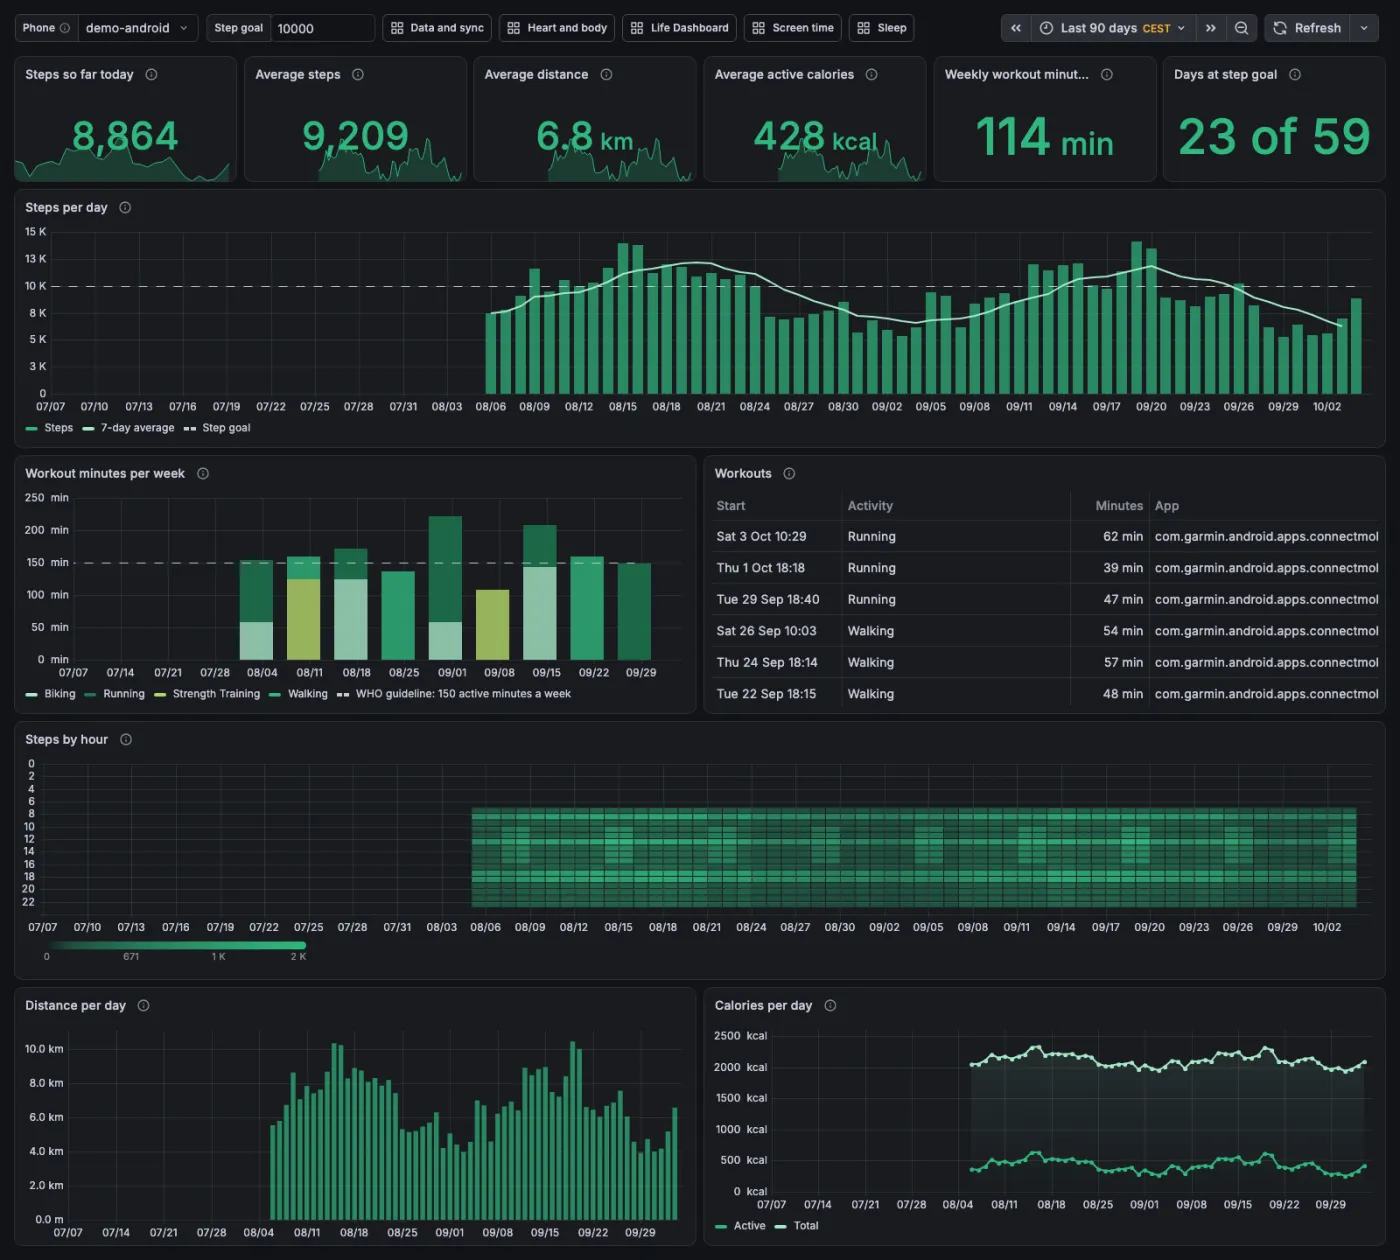
  • Activity and Sleep Steps by hour, workout minutes against the WHO guideline of 150, a hypnogram, bedtime and wake time.
  • Heart and body Heart rate per hour, resting heart rate, HRV, SpO2, breathing rate and weight with its 7-day mean.
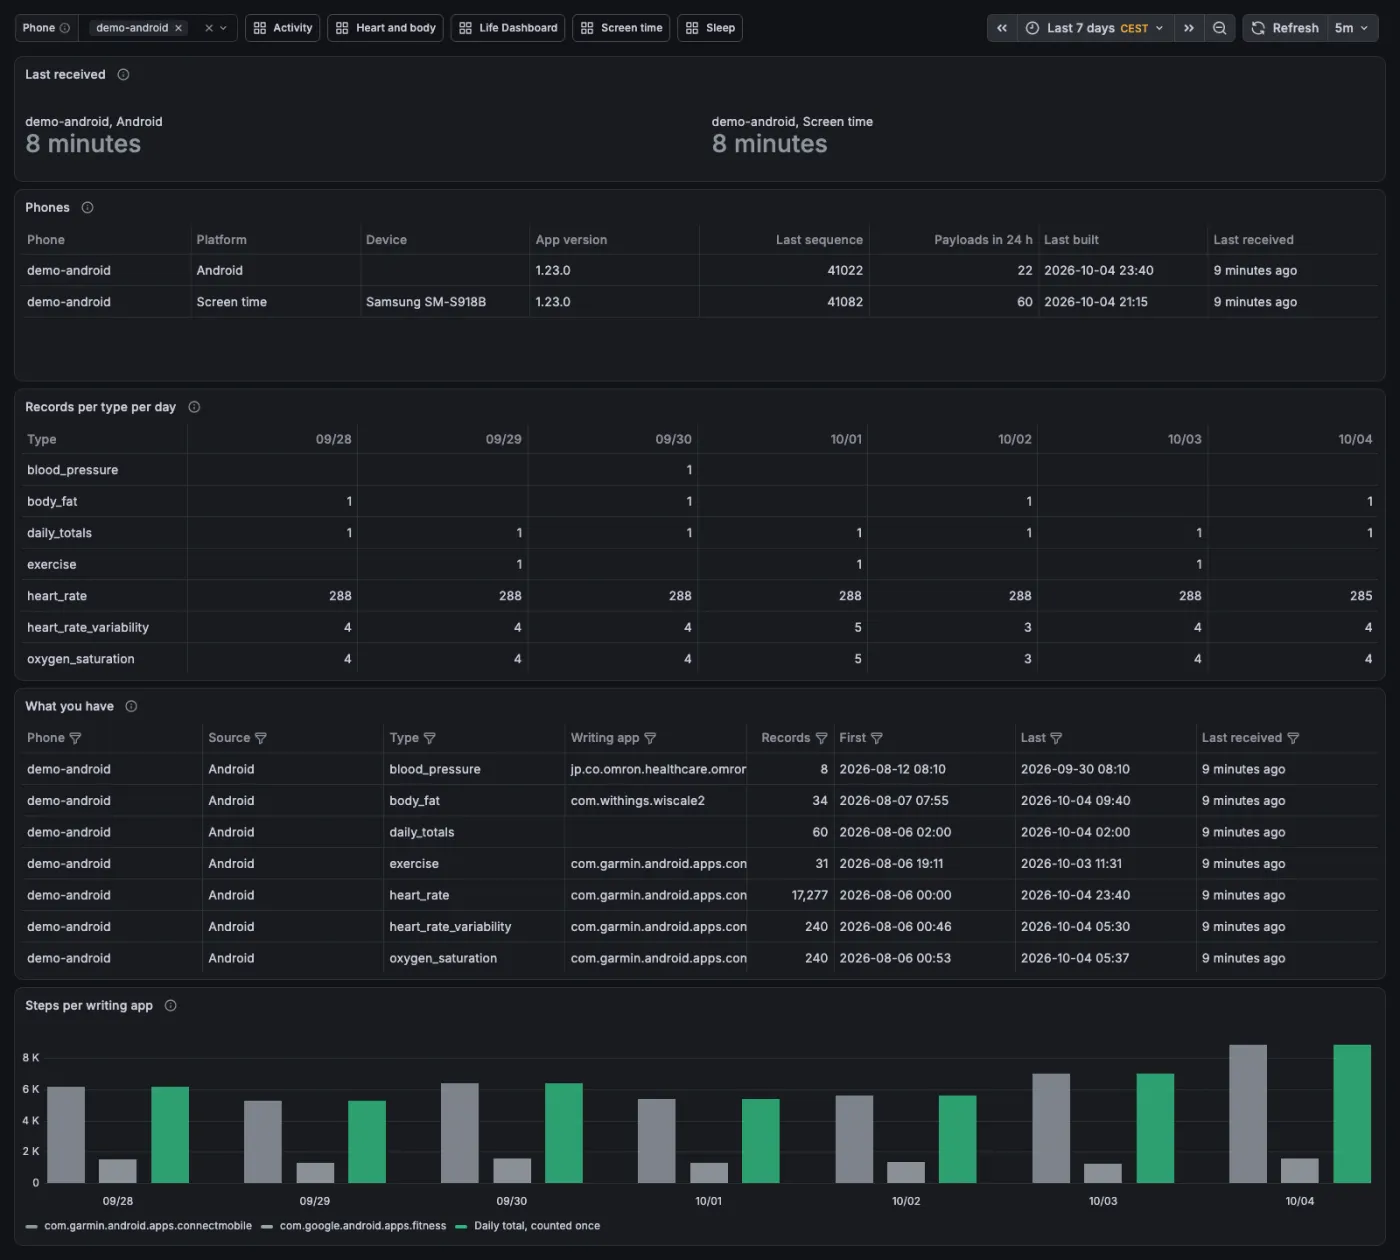
  • Screen time, Data and sync Minutes per app and per day, the last use before sleep, and when each phone last sent data.
All six dashboards
Install
mkdir life-dashboard && cd life-dashboard
GH=https://github.com/owen282000/life-dashboard-stack
R=$GH/releases/latest/download
curl -fsSLO $R/docker-compose.yml
curl -fsSL -o .env $R/env.example
# in .env: WEBHOOK_SECRET, TZ, PUBLIC_URL, passwords
docker compose up -d
docker compose logs receiver   # the pairing code
Install and pairing

One compose file, and a QR code for each phone

Each release has a docker-compose.yml and an example .env. The receiver, Postgres and Grafana come as published images, so two downloads and one command start the stack.

  • On a home server or a Raspberry Pi Any machine with Docker and Compose that your phone can reach. The images are published for amd64 and arm64, so a Raspberry Pi with a 64-bit OS can run them; 32-bit is not supported.
  • Paired like Home Assistant With PUBLIC_URL set, the receiver prints a QR code in its log, and /pair shows it as a page to your own network only.
  • A label per phone Every phone gets its own code and its own Phone in the dashboards, so an Android phone and an iPhone sit side by side.
  • Upgrades that keep working Set LIFEDASH_VERSION to the new release, then pull and start again. Within a major version, your own queries, panels and .env keep working.
The quick start
The activity dashboard of the Grafana stack
How it counts

No scores, and a gap where data is missing

Nothing is colored as good or bad. Goals are dashed lines you can change at the top of a dashboard.

  • Steps counted once Steps, distance and calories come from the phone's daily totals, so a walk recorded by phone and watch counts once.
  • Local days in your time zone A night belongs to the morning you wake up. Today is marked “so far” and left out of averages.
  • HRV kept apart RMSSD from an Android watch and SDNN from an Apple Watch are different measures, so they're never mixed.
  • Gaps, not zeros A missing day shows as a gap. The only red is a phone that sent nothing for 24 hours.
The data and sync dashboard of the Grafana stack
SQL and API

Your data back, in SQL or as JSON

The dash views hold one row per day, night, hour or app, with local days already worked out. Query them with psql, in a Grafana panel of your own, or through the read-only API. Every view, column and unit is documented.

  • dash.activity_days and dash.sleep_nights Steps per day, counted once, and hours asleep, deep and REM per night, per phone.
  • A read-only JSON API With API_TOKEN set, /api/ answers with days, nights, workouts, screen time, one metric as a series, or a trend against the period before.
  • Read-only users Grafana reads as grafana_ro, the API and the MCP server as dash_ro. Neither can write, and their queries stop after 30 and 15 seconds.
  • Off until you want it Without a token, every path under /api/ is a 404. Behind a reverse proxy, forward only /webhook if you don't need the API outside.
Every endpoint of the API
Start the MCP server
echo "MCP_TOKEN=$(openssl rand -hex 32)" >> .env
docker compose --profile mcp up -d

# then, in your MCP client:
# URL     http://<this machine>:8090/mcp
# Header  Authorization: Bearer <MCP_TOKEN>
Your own AI

Ask your own AI, through a read-only MCP server

An optional fourth image gives a model you choose six read-only tools: list_phones, daily_summary, sleep_nights, workouts, trend and screen_time. It speaks Streamable HTTP with a bearer token, for Open WebUI, LM Studio or any MCP client, and stdio for Claude Desktop on the same machine.

  • Read-only all the way The tools read the dash views as dash_ro. There's no tool that writes and none that takes SQL, so a model can't change or delete anything.
  • A local model keeps it at home With Ollama and a chat client that speaks MCP, the questions, the data and the answers stay on your hardware.
  • A cloud model sees what it asks for With Claude or ChatGPT, Claude Desktop included, your questions and every tool result go to that provider.
  • Nothing by itself The stack sends nothing to any AI. The server only answers a client you connect with your MCP_TOKEN.
Connect a model, step by step
Install with Helm
# CloudNativePG first, once per cluster
helm install lifedash \
  oci://ghcr.io/owen282000/charts/life-dashboard \
  -n life-dashboard --create-namespace \
  -f my-values.yaml --wait --timeout 10m
helm test lifedash -n life-dashboard --logs
Kubernetes

A Helm chart for a cluster of your own

The chart runs the same images. Postgres comes from CloudNativePG by default, with replicas, failover and backups to object storage. Without the operator, a bundled StatefulSet or a Postgres you already run works too.

  • Secrets made once Generated at the first install and kept on every upgrade, or taken from a Secret of your own, such as from Sealed Secrets, External Secrets or SOPS.
  • Pod Security restricted Non-root pods with a read-only root file system and no service account token. NetworkPolicies are there when you switch them on.
  • Backups to object storage Through CloudNativePG's Barman Cloud plugin: a base backup on a schedule and the WAL in between, so a restore can go back to a moment.
  • Only /webhook outside The Ingress or Gateway API route opens only /webhook by default. helm test checks the receiver, the dashboards, the API and the MCP server.
The chart, from CloudNativePG to uninstall
Install

Run the stack

Life Dashboard stack

Postgres, Grafana, an API and MCP, self-hosted

Run with Docker Compose

Download docker-compose.yml and the example .env from the latest release, set the secret, your time zone, the address and the passwords, then docker compose up -d. Nothing to clone or build.

  • Demo data Available60 days of made-up data for two phones, from the same compose file, before any phone of yours is involved.
  • Helm chart for Kubernetes AvailableThe same images on a cluster of your own, with Postgres from CloudNativePG, a bundled StatefulSet or a database you already run.

What you need

Docker with Compose, on a machine your phone can reach on the same network or over a VPN: a home server, a NAS or a Raspberry Pi with a 64-bit OS, as the images are published for amd64 and arm64 only. Or a Kubernetes cluster with Helm 3 or 4, with CloudNativePG for the default Postgres. On each phone, Life Dashboard Companion for Android or for iPhone, paired by QR code or pointed at the receiver's webhook URL on port 8080 with a label for that phone and the same secret as WEBHOOK_SECRET. Set that secret: without one the receiver accepts unsigned payloads and shows no pairing code. To reach the receiver from outside, put a reverse proxy with TLS in front of it. The stack is offered as a starting point you can change, not as a finished product.

Receives from Life Dashboard Companion for Android and for iPhone.

Try it with demo data
mkdir lifedash-demo && cd lifedash-demo
GH=https://github.com/owen282000/life-dashboard-stack
curl -fsSLO $GH/releases/latest/download/docker-compose.yml
RECEIVER_PORT=18080 GRAFANA_PORT=13000 \
  docker compose -p lifedash-demo \
  --profile demo up -d

Give it a minute, then open http://localhost:13000 and log in as admin with the demo password lifedash. docker compose -p lifedash-demo --profile demo down -v removes all of it. For your own data, the quick start has the two downloads and the settings.

FAQ

Questions about the stack

Can I try it before I connect a phone?

Yes, if you can run Docker. The demo profile in the same compose file starts the stack with 60 days of made-up data for two phones, under its own name and ports. The commands are under Run the stack. Without Docker, the screenshots on this page show the same dashboards.

Do I need to clone the repository?

No. Each release has a docker-compose.yml and an example .env, and the receiver, Postgres, Grafana and the MCP server are published images for amd64 and arm64. A clone is only for changing the receiver, the views or the dashboards themselves: a second compose file then builds the images from it.

Is my data sent anywhere?

No. There's no Life Dashboard server and no account: the phones send to your receiver, and the data stays in your Postgres. Grafana's usage reporting and update checks are switched off. Data only leaves when you connect something yourself, such as a cloud model over MCP, a script with the API token, or a reverse proxy you open to the internet.

Can my AI read the data?

Only if you let it. Start the optional MCP server with an MCP_TOKEN, and a model you connect gets six read-only tools for phones, days, nights, workouts, trends and screen time. It reads as dash_ro, so it can't write, delete or run SQL of its own. With a local model through Ollama, everything stays on your hardware; with a cloud model, Claude Desktop included, your questions and every tool result go to that provider. Health Connect data over MCP has the setup.

Does it run on Kubernetes?

Yes, with a Helm chart for Helm 3 or 4. By default Postgres runs as a CloudNativePG cluster, with replicas if you want them and backups to object storage through the Barman Cloud plugin. Without CloudNativePG, the chart runs Postgres as one bundled pod or uses a Postgres you already run. The pods meet the restricted Pod Security Standard, and NetworkPolicies, an Ingress and Gateway API routes are optional. docs/kubernetes.md has the steps.

Can I put it on the internet?

Put a reverse proxy with TLS in front of the receiver, forward only /webhook, and allow request bodies of 32 MB. The API shares the receiver's port, and /pair shows the signing secret: the receiver answers /pair only to your own network and never through a proxy, but a proxy that adds no forwarding header, or Docker Desktop's port forwarding, can make an outside request look local, so block it there or set PAIRING_PAGE=0. Keep Grafana and the MCP server on your own network or behind a VPN: anyone who can view a dashboard can read every health record. Before the first start, change GRAFANA_PASSWORD, GRAFANA_DB_PASSWORD and DASH_DB_PASSWORD in .env. Postgres publishes no port, so only the stack's own services reach it.

Can I use it next to Home Assistant?

Yes, as a second home for the data, with two things to know. The Android app has one signing secret per tab (Health, Screen Time), the iPhone app one for all its webhooks. Pairing adds the receiver's URL and replaces that secret, and the dialog names the URLs that get signed with the new one, so pairing with the stack after Home Assistant gives Home Assistant payloads it refuses. Pair with Home Assistant, add the stack's webhook URL by hand, and set WEBHOOK_SECRET in the stack's .env to the same secret; or send one phone to each. A secret per destination is planned. And a payload counts as delivered once one destination takes it, so if the stack is down at that moment, it misses that payload.

How do I upgrade?

Set LIFEDASH_VERSION in .env to the new release, then run docker compose pull && docker compose up -d. Set it to the major version alone, and every pull follows the releases that keep compatibility. Within a major version, the payloads, the database, the dash views, the read-only users, the settings and the ports stay the same, as docs/compatibility.md lists. An older install from a clone moves its data over once with a script that leaves the old volume untouched; the README has the steps.

How do I back it up?

With Docker Compose, one pg_dump line writes a dump, and one pg_restore line puts it into a fresh stack. Restart the receiver afterward so it rebuilds the views and the grants of the read-only users. On Kubernetes with CloudNativePG, backups go to object storage on a schedule, and a restore starts a new cluster from them.

Can I change the dashboards?

Yes. They're built into the Grafana image, so Grafana won't save changes over them, and an upgrade brings their new versions along. Use Save as for a copy of your own, which an upgrade leaves alone. To change the originals, edit the JSON in a clone and build the images from it. Keep views of your own in the public schema, because the receiver rebuilds dash at every start.

I already run Grafana. Can I use mine?

Yes. Run the receiver and Postgres from the stack, and in your own Grafana add a PostgreSQL data source for the stack's database with the read-only user grafana_ro and your GRAFANA_DB_PASSWORD. Then import the six dashboard files from grafana/dashboards/life-dashboard/ and pick that data source. grafana_ro can read the records, the buckets and the dash views, and nothing else.

What doesn't it do yet?

Series sent per time window are stored, but only the heart rate panels read them, so leave Data Resolution on Every record. Days follow the stack's one time zone, and a backfill doesn't remove records the phone no longer has. The API and the MCP server answer per day, night and workout, not with raw records. The known gaps list the rest.